Help and Glossary
How RFID Based Wait and Crossing Time System Works
Current Border Crossing Information System uses Radio Frequency Identification (RFID) technology to measure travel times between the RFID readers installed at major points of the border crossing process. Usually during its trip across the border at the POE, a truck passes under two or more RFID reader stations. The RFID reader station detects the truck's tag identification number and makes a time stamp of the record. The tag IDs and time stamps are transmitted to the central server via communication links for further processing and archiving. Figure 1 shows a schematic diagram of RFID readers and their locations along the flow of U.S. bound trucks.
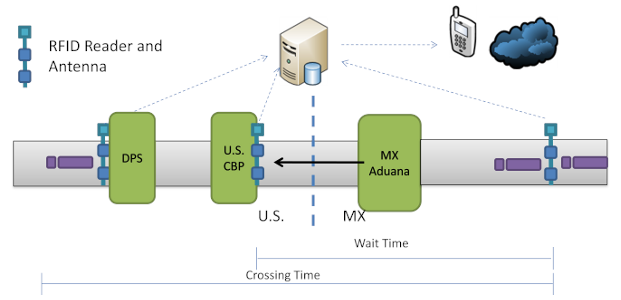
Figure 1 : Schematic Diagram of RFID System to Measure Border Travel Times
Location of RFID Reader Stations
Locations of RFID reader stations are carefully selected to capture the movement of the trucks from Mexican streets to the end of border crossing process. As shown in Figure 1 there are three major border inspection facilities in terms of freight movement:
- Mexican export lot: A facility operated by Mexican customs (Aduana) that is responsible for inspecting export materials leaving Mexico. Generally only a small percentage of freight is physically inspected at this facility.
- U.S. Federal inspection compound: This facility is operated by U.S. Customs and Border Protection (CBP). Its primary function is to make sure no illegal freight is enter the United States. Secondary inspections can occur here if CBP feels further examinations of the driver, freight, or conveyance are needed.
- State inspection facility: This facility is operated by the State's Department of Public Safety (DPS). Its primary function is to ensure that tractors and trailers entering the United States from Mexico are safe enough to operate on U.S. roadways. Secondary inspections of the vehicles can occur here if deficiencies are revealed through a preliminarily review by DPS.
Calculation of Wait Time and Crossing Time
Border crossing travel time can be described by two different types of measures. Wait time is defined as "the time it takes, in minutes, for a vehicle to reach the CBP's Primary Inspection booth after arriving at the end of the queue." This queue length is variable and depends on traffic volumes and processing times at each of the inspections facilities. Crossing time has the same beginning point in the flow as wait time, but its terminus is the departure point from the last compound that a vehicle transits in the border crossing process as shown in Figure 1.
Wait time is calculated from the matched RFID reads between the MX streets before Aduana and U.S. CBP. Crossing time is calculated by adding the travel time between U.S. CBP and DPS to the wait time so that it can cover the overall border crossing process at predefined time intervals (10 minutes and 1 hour).
Real-Time Information and Archived Data
The main screen of Border Crossing Information System shows the real time information about wait and crossing times with brief descriptions of each travel segment. The wait and crossing time table also shows the last update time to give information about the current status of border crossing activities. When a bridge name is clicked in the table, an additional screen pops up to show the traffic conditions in color coded routes in the map. The map also shows the exact locations of RFID stations across the border.
In addition to the real-time information, past border crossing data such as monthly performance indicators can be retrieved by Query Archived Data menu. Query Archive Data screen allows users to select various performance measures for each bridge at the selected date range.
Glossary of Terms
Wait Time: The time it takes for a vehicle to reach the CBP's Primary Inspection booth after it arrives at the end of the queue. Currently it contains the service time of primary inspection.
Crossing Time: The time it takes for a vehicle to exit the border crossing process after it joins the queue before CBP primary inspection booth. Crossing time has the same beginning point in the flow as wait time, but its terminus is located at the end of federal and state inspection compounds.
Individual Segment Travel Times: The time it takes for a vehicle to travel a segment between the two RFID stations. Usually there is one RFID station (except Pharr) in Mexican street and two RFID stations in U.S. (CBP primary and the exit of DPS).
Tag Count: Total count of transponders identified by individual RFID readers at 10- and 60-minute intervals.
10 Minute Average Travel Time: Average Travel Time of US bound commercial vehicles, for the selected segment over the selected time period, calculated at every 10-minute interval.
Hourly Average Travel Time: Average Travel Time of US bound commercial vehicles, for the selected segment over the selected time period, aggregated at every 1-hour interval.
Histogram of Raw Travel Time: Number of tag counts by travel time interval on the selected day in a bar chart. Cumulative probability line chart also shows the chance of border crossing with the given minutes or less.
Daily Percentage Trucks Congested: Percentage of trucks that took longer travel time than the average travel time for the selected segment on a given day.
Monthly Percentage Trucks Congested: Percentage of trucks that took longer travel time than the average travel time on a given month.
Monthly Performance Indicators: Various performance measures about crossing times and sample size shown in a single chart. It is convenient to observe the performance changes over the months.